Obesity: Sugar-Sweetened Beverages Increase Toddlers’ Risk
There have been many and to spare studies which show that adults, teens and even pre-teens who drink sugar-sweetened beverages (SSB) in their diet are statistically more obese. Now, finally, we’ve got relevant data for 9 month to 5 year olds too.
High Fructose Corn Syrup is sweeter than most things (and cheaper as an ingredient) so has become an ingredient in just about everything – most of which the public has no idea about! I wouldn’t be surprised if it was even added to shoe polish.
And, exactly at the same time its use has become nearly universal, the worlds population has gotten obese right along with the amount of consumption. Just look around! Replicated studies have repeatedly shown statistical correlation between SSBs and Obesity for older age groups.
Obesity Studies and Interventions Children
Until now, however, similar studies on infants and children have been inadequate in sample size or demographics, so have been inconclusive. Still, the implication was strong enough for the American Academy of Pediatrics (AAP) to recommend parents not allow consumption of sodas, sports drinks and juices with added sugar – SSBs.
To date, I’m sad to say, the message doesn’t seem to be getting through very well. Perhaps this new information about just how early obesity starts in children will help get the message through.
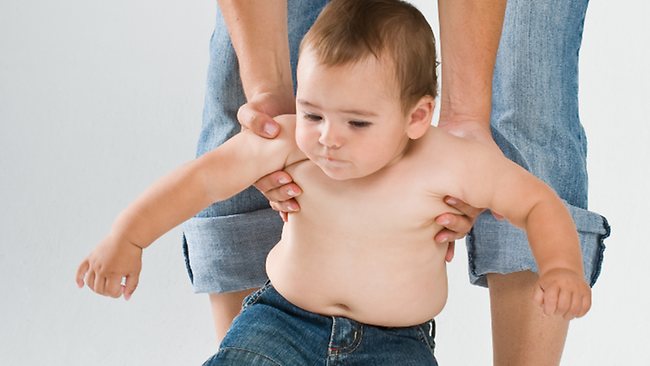 A study by researchers in Virginia has been published in Pediatrics, the journal of the AAP, which shows the same statistical relation with SSBs and obesity in two to five year olds as there is in older children and adults – really no surprise.
The researchers gathered information from parents and doctors of 9,600 children who were being followed in the Early Childhood Longitudinal Survey. They then adjusted statistically for television viewing habits, socioeconomic status, race/ethnicity and even mother’s body mass index in order to filter out any other confusing factors.
The study children were examined and their body mass index was recorded at ages 9 months, 2 years, 4 years and 5 years and at the same time their parents were interviewed.
What they found was that by 2 years of age 9 percent of parents were feeding their child at least one SSB per day. That increased to 13% by 4 years of age but the actual number wasn’t recorded. One would assume a four-year-old would be drinking a greater number each day; but that, unfortunately, wasn’t recorded.
Even with that limitation, the statistics were strong enough to reveal that children who began drinking even one SSB by age 2 years suffered a greater rate of increase in weight during the next 2 years than did their non-SSB-drinking peers.
Research Findings
There is so much “normal” growth going on between birth and 4 years of age that it’s difficult to sort out excessive weight gain; but, by four years the weight due to SSB drinking becomes statistically observable.
By age five those who consumed the products regularly, when compared with age-mates who never or rarely drank soda and sweetened juices, had a higher odds ratio for obesity (1.43; confidence interval, 1.10 – 1.85; P < .01).
The Rest of the Story
 Like I’ve mentioned several times before however, the statistics can only show that there’s a relation to the events, NOT that one is the direct cause of the other. It just may well be that both of them are as a result of some other, yet unknown, event.
For example, the reason the researchers made effort to match the study children and the control group with equal numbers of television viewers, ethnic groups, socioeconomic levels and mothers BMIs was because they found increased numbers of these groups in the sample of SSB drinkers.
Black and Hispanic children were more likely to frequently consume SSB, as were those on the lower end of the socioeconomic scale and those whose mothers were overweight or obese.
Children who drank the most SSBs were also more likely to spend more than 2 hours a day watching television and to drink less than a single serving a day of milk.
The researchers felt that the findings were strong enough that they should be reported for parents to act upon but also felt that in the future it would be good to also do more actual monitoring than relying on parent questionnaires, gather more dietary and exercise information and get information on the fathers as well.
What Do We Do?
The sad part of it all is that there is absolutely NO NEED for a healthy child to be given sugar sweetened beverages at all! Especially in this age group who totally rely on their parents to make decisions for them to keep them safe.
Who benefits from their consumption? Manufacturers, Ad agencies, distributors – no one else.
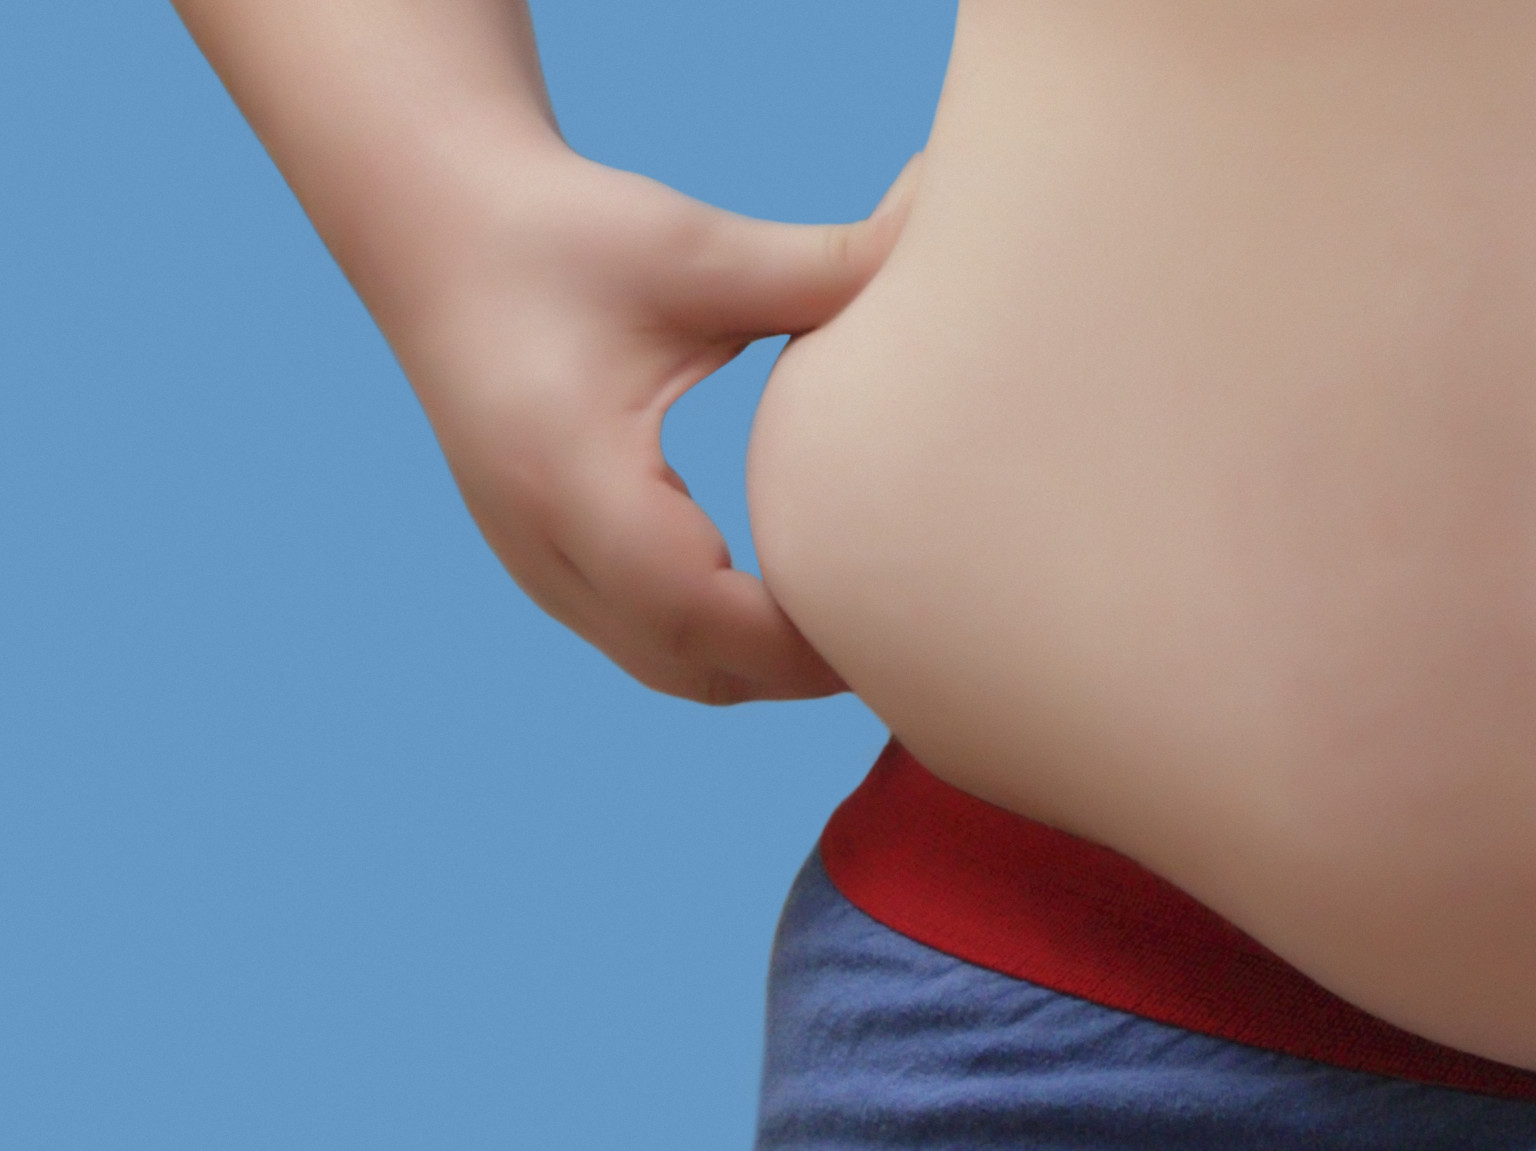 Obesity in childhood is a health-damaging epidemic of society-damaging proportions. And, the efficacy of the solutions are so effective in this age group. It’s just terrible to waste the opportunity.
We’ve just got to get the word out in a meaningful way. Parents merely need to control the SSBs and sugars, TV and other screen time and physical activity levels.
What are we waiting for? Habits in this time of life carry over to adulthood and believe me, obesity is a triple-gazillion times easier to prevent than to reverse!
The attempts to force a public-face on the problem by the politicians in New York, even though a bit mis-guided, was the issue the policy makers actually NEED to be working on.
This research article was accompanied by an editorial of sorts by professors at US San Francisco and Berkeley in substantial public policy positions. In light of the failure of the New York attempt they advocate:
- instituting best practices for beverages in child care settings and training providers and children to recognize and consume alternative drinks;
- targeting SSB-reducing interventions beyond the child-care setting to include parks, mobile vendors, and restaurants, which could provide water or milk instead of SSB;
- adding water to the government’s “My Plate” guidelines;
- developing educational materials for health educators and clinicians; and
- prohibiting marketing of SSBs to children.
[Pediatrics, August 5, 2013]
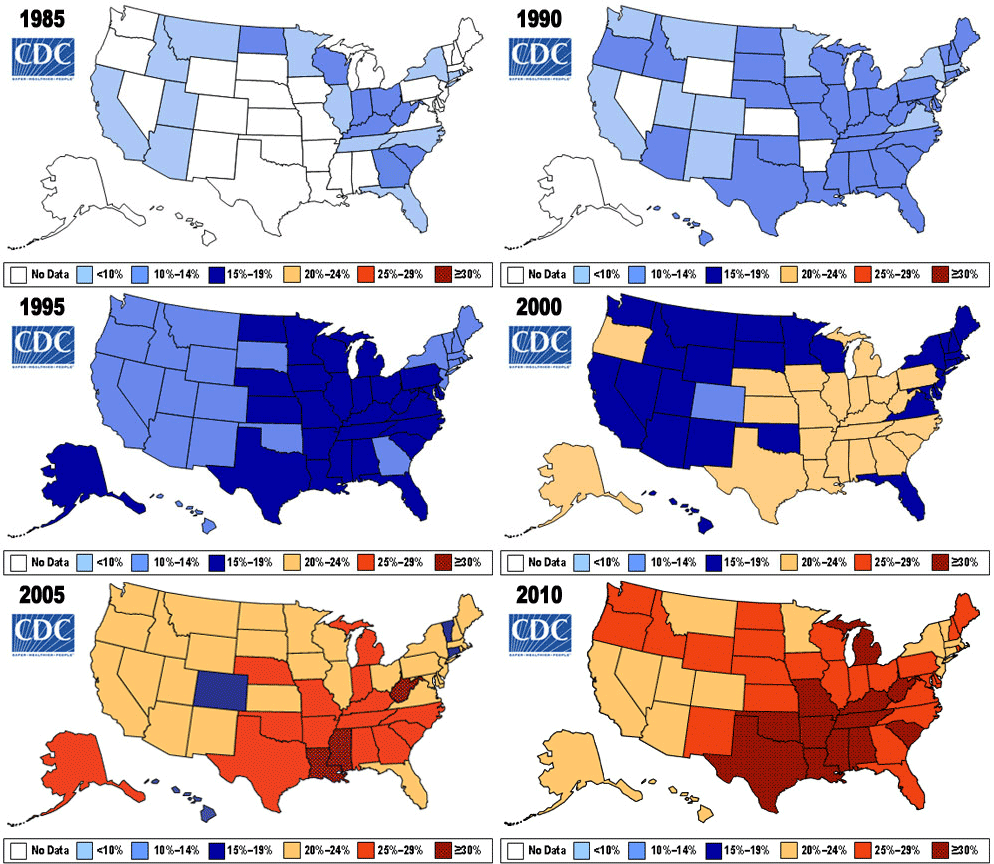
Growing US Obesity Epidemic
I found this graphic which is a tell-tale representation of the gigantic health problem the US is in. I put it at the bottom not because it isn’t important but because its animation is quite distracting when reading other things.
This color-codes the US states and their percentages of their population who are medically obese (defined by an adult or child having a Basal Metabolic Rate over 30%!)
Just so you’ll know the MOST FAT of all US cities in 2012 was McAllen-Edinburg-Mission, Texas which had 38.5% of its population medically obese. The LEAST FAT was Boulder, Colorado with a 12.5% obesity rate.
12 Posts in Obesity (obesity) Series
- Five Diseases Reduced by Excersize – 7 Apr 2019
- Obesity now more common in world than being underweight – 18 Apr 2018
- BIG SODA, advertising conflict of interest – 2 Nov 2016
- Where does the fat go? – 9 Feb 2016
- Teens - Treadmill Dance to fight obesity and get fit – 1 Feb 2016
- 10 Ways To Ditch Obesity – 24 Jan 2016
- Fast Food – 16 Jan 2016
- Video: How to make our day harder - to expend more energy – 1 Dec 2015
- Type 2 Diabetes - Some Odd Possible Correlations – 6 Nov 2015
- Gastric Band Last Resort for Teen Obesity – 17 Aug 2015
- Obesity in Toddlers and Sugar-Sweetened Drinks – 10 Oct 2013
- Obesity Series: Intro/Index – 9 Oct 2013
